Diseases Prevalence and Behavioral Choices in Nevada
Introduction
Determining the health of a state population is a complex task. It involves knowing at least the prevalence of various diseases and conditions as well as the leading causes of death and disability compared to a national mean or median. The World Health Organization defines health as “a state of complete physical, mental and social well-being and not merely the absence of disease or infirmity.” Since health is affected by numerous social, economic, environmental, and cultural factors, these factors must also be considered when examining the health status of a population. All attempts to rank states in health are limited by the type and quality of available data. A remarkable array of health-related data is collected by federal, state, and local governmental agencies. Meaningful analyses of this data are usually limited to the mission of the collecting agencies and available funding.
One of the farthest-reaching attempts to set goals to improve the health of the nation is the Healthy Nation 2010 Initiative, http://www.healthypeople.gov/. The two main goals of the program are to increase the number and quality of years-of-life and to reduce health disparities across the nation. There are 28 focus areas associated with this initiative:
- Access to Quality Health Services
- Arthritis, Osteoporosis, and Chronic Back Conditions
- Cancer
- Chronic Kidney Disease
- Diabetes
- Disability and Secondary Conditions
- Educational and Community-Based Programs
- Environmental Health
- Family Planning
- Food Safety
- Health Communication
- Heart Disease and Stroke
- HIV
- Immunization and Infectious Diseases
- Injury and Violence Prevention
- Maternal, Infant, and Child Health
- Medical Product Safety
- Mental Health and Mental Disorders
- Nutrition and Overweight
- Occupational Safety and Health
- Oral Health
- Physical Activity and Fitness
- Public Health Infrastructure
- Respiratory Diseases
- Sexually Transmitted Diseases
- Substance Abuse
- Tobacco Use
- Vision and Hearing
We believe that it is important for Nevada to begin the development of the appropriate databases to track these focus areas longitudinally.
To arrive at a clearer picture of the health of Nevadans, we must develop the appropriate data collection systems and secure the funding for regular data analyses. These analyses then can be used to produce a state health report card on a regular basis for the people of Nevada.
Data Available to Examine the Health Status of Nevadans
The United Health Foundation publishes an annual report America’s Health Rankings for 2005, http://www.unitedhealthfoundation.org/shr2005/index.html. The report uses 18 health-related indicators from national data sets to determine a ranking for each state. In this chapter, we use the 2005 report to examine the health status of Nevada. The report assigns a score to the 50 states for each indicator that compares the state with the national average. A sum of the scores of the 18 indicators gives a total score for the state. Not all indicators are weighted the same for the total score. The states are ranked from 1 to 50 using the summary scores, with the 1st rank assigned to the best performing and 50th to the worst performing state.
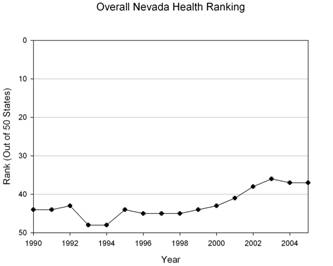
- America’s Health Rankings for 2005 shows Nevada 37th in overall health of the 50 States (Minnesota was 1st and Louisiana was 50th). This leaves much room for improvement, although the rank has risen from the 1990’s when Nevada was consistently ranked as one of the five unhealthiest States in the nation (See Table 1 in the Appendix).
In the text the follows, we examine the components of the America’s Health Rankings and compare Nevada with the national average for each of the 18 indicators. These indicators are grouped into 4 categories: personal behavior, community environment, health policy and outcome measures. We use additional data sets not included in the report to point out some particular Nevada health issues. You will find relevant tables summarizing the data in the Appendix at the end of this chapter.
A Comparison of Nevada Rankings with National Averages
Personal Behaviors
Nevada is above the national average for Prevalence of Smoking and Motor Vehicle Deaths (See Table 2). Smoking leads to premature death and disability especially with regard to cancer, respiratory and cardiovascular diseases. Nevada’s high smoking prevalence is a major reason for the state’s poor health rankings.
- While smoking prevalence decreased from 35.7% of Nevada’s population in 1990 to 23.2% in 2004, smoking remains one of Nevada’s most serious risk behaviors for chronic diseases and premature mortality.
Decreasing smoking prevalence should be one of the state’s top priorities for improving health.
On the positive side, we note that Nevada is well below the national average in prevalence of obesity in the category under review.
- Nevada’s rank of 11 is the highest rank for any of the indicators.
There are indications, however, that obesity rates especially among children may be rising faster in Nevada than in the rest of the nation. Obesity prevention should be a state priority. Good health is directly related to years of education. Improving the high school graduation rates is an important step to improving the health of Nevadans.
Community Environment
- Nevada is well above the national average in violent crime and lack of health insurance which constitute the 2nd worst rankings for the state, 43rd and 44th respectively (See Table 3 and 4).
Poverty is inversely related to good health. In comparison with other states, Nevada has a lower percentage of children in poverty than the national average, and this is a very positive factor.
Three infectious diseases are included in the state ranking, hepatitis (all types), AIDS and tuberculosis.
- In 2004, Nevada had an annual AIDS case rate of 13.1 per hundred thousand people and a tuberculosis case rate of 4.1, putting Nevada in the top 20 state case rates for both diseases.
Hepatitis case rates were not available for Nevada for 2004. Other infectious diseases of concern which are not included in these rankings are sexually transmitted diseases, particularly syphilis and gonorrhea.
- Between 2000 and 2004, gonorrhea rates increased from 85.0 to 137.3 while syphilis rates increased from 2.6 to 11.3 per 100,000 persons (See Table 5).
The high rate of sexually transmitted diseases in Nevada indicates that safe sex messages have not been very effective. The presence of a sexually transmitted disease increases the risk for acquiring HIV from an infected partner which may explain in part the high rate of AIDS cases. It is urgent that Nevada develop a state strategy for reducing rates of sexually transmitted diseases including HIV/AIDS.
Health Policy
- The childhood immunization rate in Nevada for 2004 was 68.4% (See Table 4), the worst in the nation and a significant drop from 75.7% in 2004.
Improving the immunization rate is critical for the health of Nevada’s children. Childhood diseases that were close to eliminated are now on the increase in the nation, including polio, measles, mumps and pertussis (whooping cough). This should be Nevada’s number one priority for intervention.
- The percent of women receiving prenatal care, although still inadequate, has increased from 70.1% in the previous year to 71.6%.
The fact that the per capita public health spending is below average in a state which values small government and limited taxation is not surprising.
Outcome Measures
The only bright spot in these outcome measures (See Table 6) is Nevada’s relatively low infant mortality rate, which is below the national average. All other mortality measures are well above the national average.
Leading Causes of Death in Nevada
Another way to look at the health of Nevadans is to look at causes of death (See Table 7).
- The leading causes of death for Nevadans in 2002 were heart disease, cancer and chronic respiratory disease lead the list. A large proportion of these 3 conditions are smoking related.
- Unintentional injury, which results primarily from motor vehicle crashes, was the 5 th leading cause of death in Nevada for all ages but was the number one killer of persons between the ages of 1 and 44 years.
- The sixth leading cause of death for all ages is suicide.
We limit our review to this snapshot since other chapters in this volume provide an in depth review of some of these indicators, including suicide and access to health care.
Prospects for the Future and Policy Recommendations
We believe that one of the main objectives of public health professionals is to provide sound healthcare to the public, reduce health disparities, and to provide appropriate data and analyses to track the health of our population. With that in mind, Nevada scholars and public health officials are in the process of securing quality data through a funded center, the Nevada Center for Environmental, and Health Surveillance. Our efforts should lead to compiling and regularly updating a state report card on health. The state of Nevada has initiated efforts to develop a center for making health policy recommendations.
Summary and Conclusions
With so many serious issues to address, the question arises where do we start to improve the health of Nevadans? How do we motivate and facilitate public participation in improving health indicators? How do we convince leaders that the efforts are worthwhile? A national model is the U.S. Public Health Service Year 2010 Objectives, http://www.healthypeople.gov/, where hundreds of health indicators are described, baseline data is gathered, and a realistic goal for improvement is selected to be reached over a ten year period. If we consider the measures for which Nevada is ranked 25 or below, i.e., where it ranks in the bottom half of the states, we can see that
- The Silver State has only 4 of 18 health indicators in this category, prevalence of obesity (rank 11), infant mortality (rank 17), children in poverty (rank 19) and occupational fatalities (rank 20).
We should work to preserve these positive ratings. A key objective for the future is to begin the development of a state report card based on the 2010 objectives. The first step is to develop health databases for Nevada that will establish baseline rates of diseases and health-related conditions and behaviors. Theses baseline rates should be reviewed annually for trends. Public health leaders in the state should develop a state plan for improvement of priority outcomes.
Data Sources and Suggested Readings
- Health Nation 2010, http://www.healthypeople.gov/
- America’s Health Rankings for 2005, http://www.unitedhealthfoundation.org/shr2005/index.html
- CDC – Behavioral Risk Factor Surveillance System, http://www.cdc.gov/BRFSS/
- National Safety Council, http://www.nsc.org/
- NationalCenter for Education Statistics, http://nces.ed.gov/
- FBI – Crime in the United States, http://www.fbi.gov/ucr/ucr.htm
- US Census, http://www.census.gov/
- CDC – Infectious Disease Surveillance, http://www.cdc.gov/ncidod/osr/
- National Association of State Budget Officers, http://www.nasbo.org/
- CDC – NationalCenter for Health Statistics, http://www.cdc.gov/nchs/
- CDC – National Immunization Program, http://www.cdc.gov/nip/
- CDC – STD Surveillance Reports, http://www.cdc.gov/std/stats/
- Centers for Disease Control and Prevention, http://www.cdc.gov/
- CDC – Vital Statistics System, http://www.cdc.gov/nchs/nvss.htm
Community Resources
- NevadaState Health Division, http://health2k.state.nv.us/
- Southern Nevada Health District, http://www.cchd.org
- UNLVSchool of Public Health, http://publichealth.unlv.edu/
This report has been prepared by Dr. Mary Guinan, Interim Dean, UNLV School of Public, and Dr. Chad Cross, Associate Professor, UNLV School of Public Health. You can contact Dr. Guinan at School of Public Health, University of Nevada , Las Vegas, 4505 Maryland Parkway, Box 3063, Las Vegas, NV 89154-3063, tel.: 702-895-5090, Email: mary.guinan@unlv.edu; and Dr. Cross at School of Public Health, University of Nevada , Las Vegas, 4505 Maryland Parkway, Box 3064, Las Vegas, NV 89154-3064, tel.: 702-895-5366, Email: chad.cross@unlv.edu.
Rank |
Age Groups |
<1 |
1-4 |
5-9 |
10-14 |
15-24 |
25-34 |
35-44 |
45-54 |
55-64 |
65-74 |
75-84 |
>85 |
All
Groups |
1 |
Conge-
nital
Anomalies
(47) |
Uninten-
tional
Injury
(12) |
Uninten-
tional
Injury
(5) |
Uninten-
tional
Injury
(10) |
Uninten-
tional
Injury
(113) |
Uninten-
tional
Injury
(115) |
Uninten-
tional
Injury
(163) |
Malignant Neoplasms
(348) |
Malignant
Neoplasms
(751)
|
Malignant
Neoplasms
(1203)
|
|
|
|
2 |
|
|
Chronic
Lower
Respiratory
Disease
(2)
|
|
|
|
|
|
|
|
Malignant
Neoplasms
(1082) |
Malignant
Neoplasms
(400) |
Malignant
Neoplasms
(3937) |
3 |
|
|
|
|
|
|
|
Uninten-
tional
Injury
(156)
|
Chronic
Lower
Respiratory
Disease
(118)
|
Chronic
Lower
Respiratory
Disease
(307)
|
Chronic
Lower
Respiratory
Disease
(492)
|
|
Chronic
Lower
Respiratory
Disease
(1174)
|
4 |
Unintentional
Injury
(15) |
|
|
|
|
|
|
|
|
|
|
Chronic
Lower
Respiratory
Disease
(215)
|
|
5 |
Maternal
Pregnancy
Complica-
tions
(12)
|
|
|
|
|
|
|
|
Uninten-
tional
Injury
(81)
|
|
|
Alzhei-
mer’s
Disease
(132)
|
Uninten-
tional
Injury
(860)
|
6 |
|
|
|
Malig-
nant
Neo-plasms
(2)
|
|
|
|
|
|
|
Influ-
enza/
Pneumonia
(128) |
Influenza/
Pneumonia
(128) |
|
7 |
|
Chronic
Lower
Respiratory
Disease
(1)
|
Malig-
nant
Neo-
plasms
(1)
|
|
|
|
|
|
|
|
|
|
|
8 |
Chronic
Respiratory
Disease
(5)
|
|
Meningo-
coccal
Infection
(1) |
|
|
|
|
|
|
|
Alzehei-
mer’s
Disease
(105) |
|
Influenza/
Pneumonia
(368) |
9 |
|
|
_
|
|
|
|
|
Chronic
Lower
Respiratory
Disease
(29)
|
|
Uninten-
tional
Injury
(53)
|
|
|
|
10 |
Circulatory
System
Disease
(4) |
|
|
|
Chronic
Lower
Respirat.
Disease
(1)
|
Complicated
Pregnancy
(3) |
Influenza/
Pneumonia
(12) |
|
|
Influenza/
Pneumonia
(51) |
Uninten-
tional
Injury
(85) |
Uninten-
tional
Injury
(52) |
|